ASPL User Guide v 1.00
© 2025 Bassem W. Jamaleddine
17. 2Rate of Change in Dissimilarity of a Process: playsim
Command: playsim
Interrogate the set variable
?10,5 setvar interrogate setvar 10 times with 5 seconds delay
Play the similarity operation and show rate of change in dissimilarity
playsim setvar where setvar is a set variable with historical
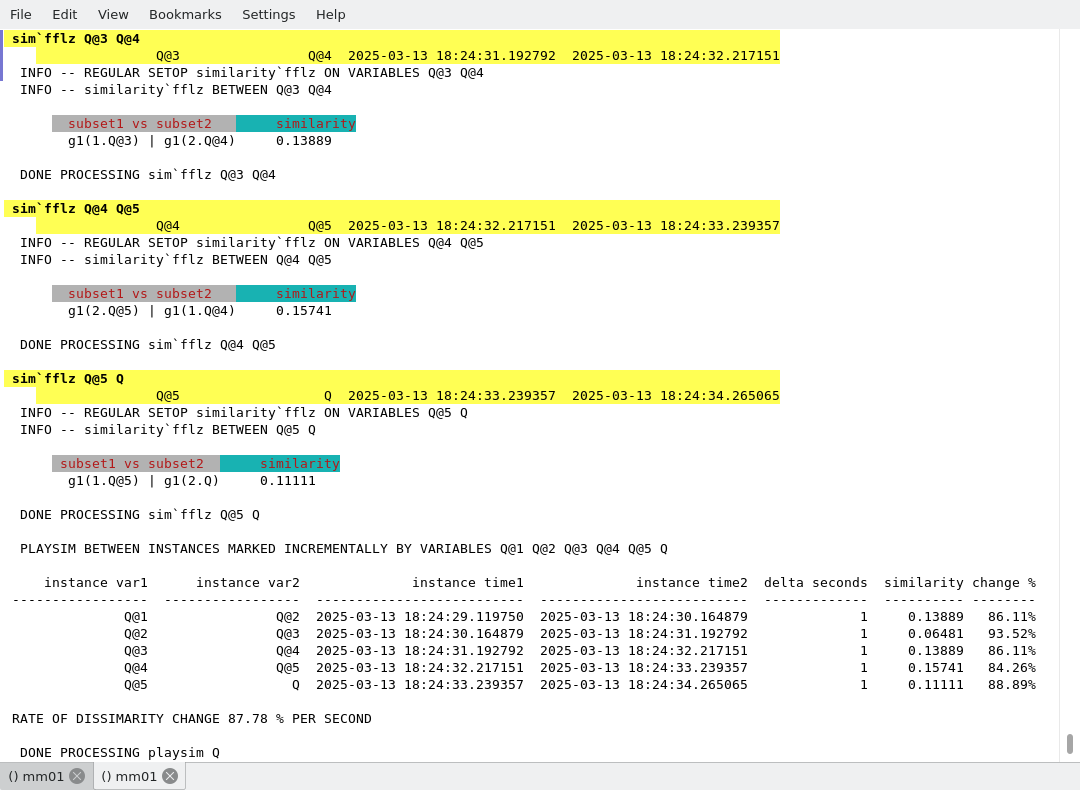
Rate of Change in Dissimilarity of a Process
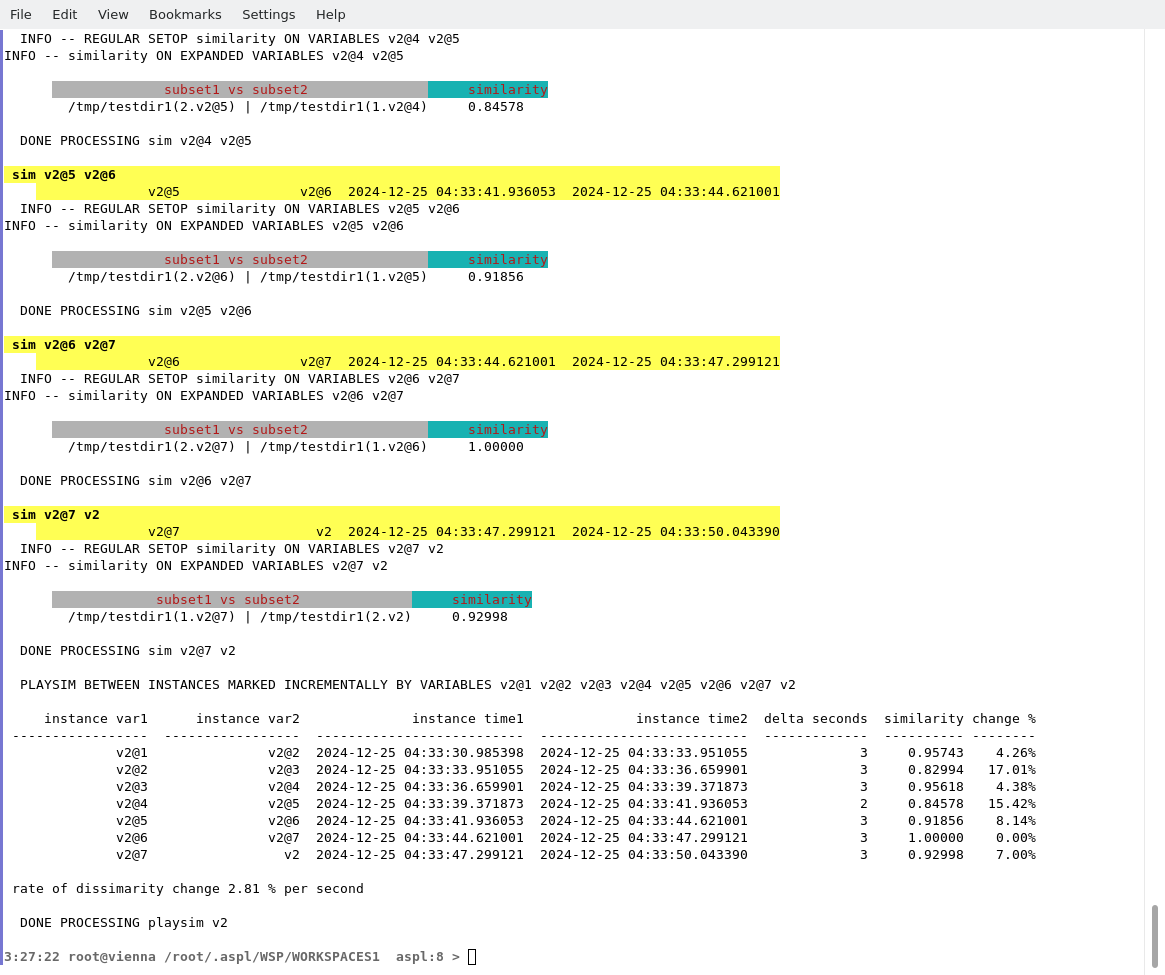
The command playsim displays the similarity between a set variable and all its archived historical. The rate of change in dissimilarity is shown once the command terminate execution.
The following example shows how to use the command playsim to reveal the changes in a the process of creating random bit group. We create a differential group variable P that represents a process, then issue the command playsim to show the rate of change in dissimilarity of the process group P.
① aspl>
P = ggbitsubgS(gstart,1,gcount,1,dmin,2,dmax,4,scount,3,smin,2,smax,4,sfcount,2,sfmin,2,sfmax,4,fcount,2,fmin,2,fmax,4,mix,1); sleep 1; ?5,1 P
(get P random bit group, interrogate the variable P in a loop, turning it into a differential group variable)
② aspl>
@ P
(print P and its archived historical data)
③ aspl>
playsim P
(display the rate of change in the dissimilarity in the process represented by P)
The following figure shows the rate of change in dissimilarity of the process group Q
The following figure shows the rate of change in dissimilarity (of subgroups) of the process group Q
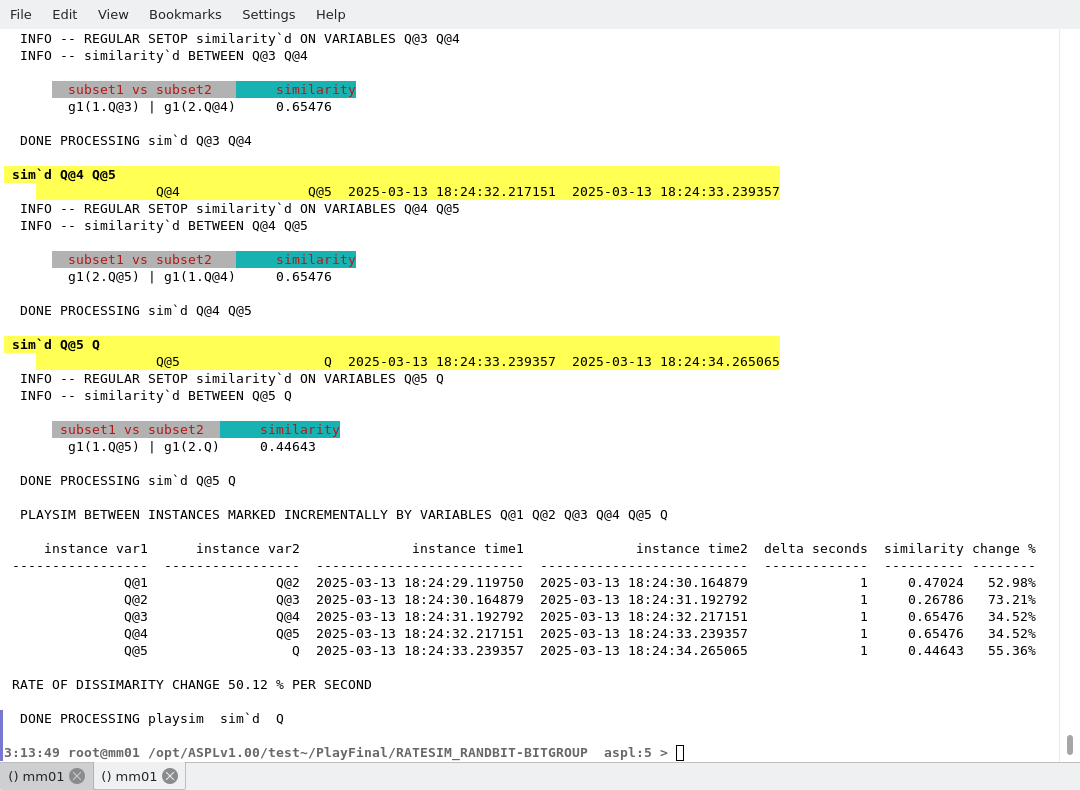
The following displays the output of various playsim commands executed in the sample workspace RATESIM_RANDBIT.
EXAMPLE1 Rate of Change in Dissimilarity of a Process: playsimStart ASPL by loading any workspace whose grouping class is BITGROUP. For example, here we load the sample workspace RANDONEBITMIX. We will create two random bit groups: one that contains three labeled groups, and another that contains one labeled group. In the following operations, these two random bit groups are denoted by mixg123 and mixg respectively.
OPERATION1 Rate of Change in Dissimilarity of a Process: playsim
# aspl RANDONEBITMIX
start ASPL loading RANDONEBITMIX
or you can start ASPL with a test workspace:
# aspl -wsname TEST123 -groupingclass BITGROUP
or you can start with any test worskpace
aspl>
mixg123 = ggbitsubgS(gstart,1,gcount,3,dcount,2,dmin,2,dmax,3,scount,2,smin,2,smax,3,sfcount,1,sfmin,2,sfmax,3,fcount,2,fmin,2,fmax,3,mix,1);sleep 2; ?7,2 mixg123
create the differential group variable mixg123
aspl>
@ mixg123aspl>
playsim mixg123
this will fail because playsim requires to have only one single labeled group
aspl>
mixg = ggbitsubgS(gstart,1,gcount,1,dcount,2,dmin,2,dmax,3,scount,2,smin,2,smax,3,sfcount,1,sfmin,2,sfmax,3,fcount,2,fmin,2,fmax,3,mix,1)
create the differential group variable mixg
aspl>
@ mixgaspl>
playsim mixg
this will show the rate of dissimilarity since mixg has only one labeled group
A sample output of the rate of dissimilarity in the differential group variable mixg is shown in the following figure.
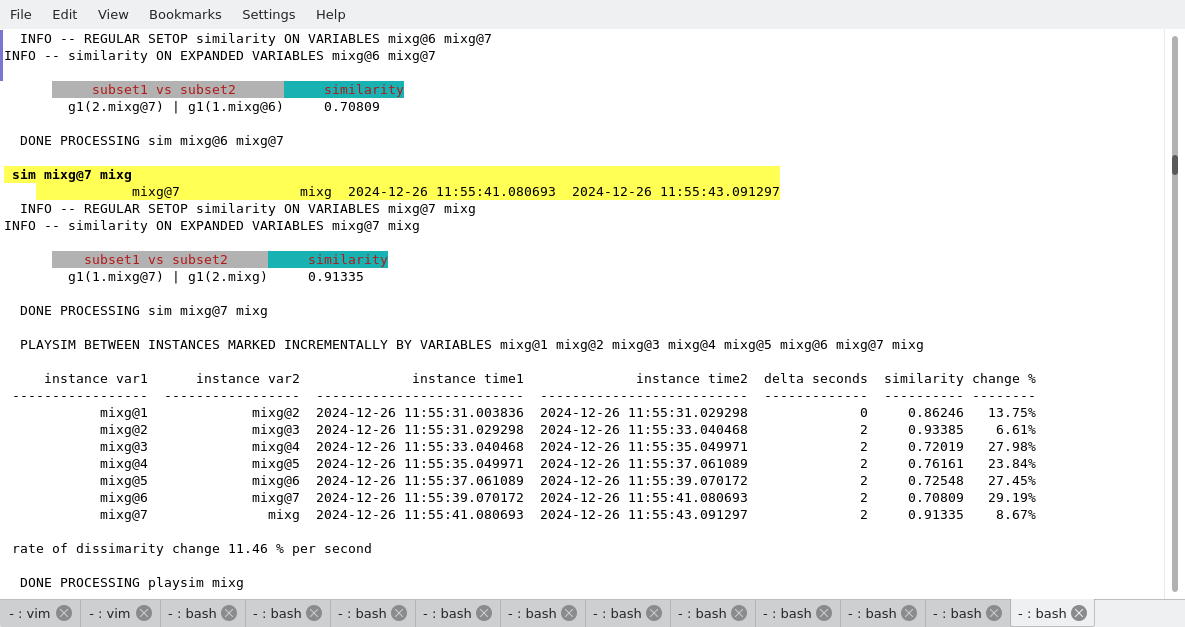
A sample output of the rate of changes in the differential group variable mixg is shown in the following figure.
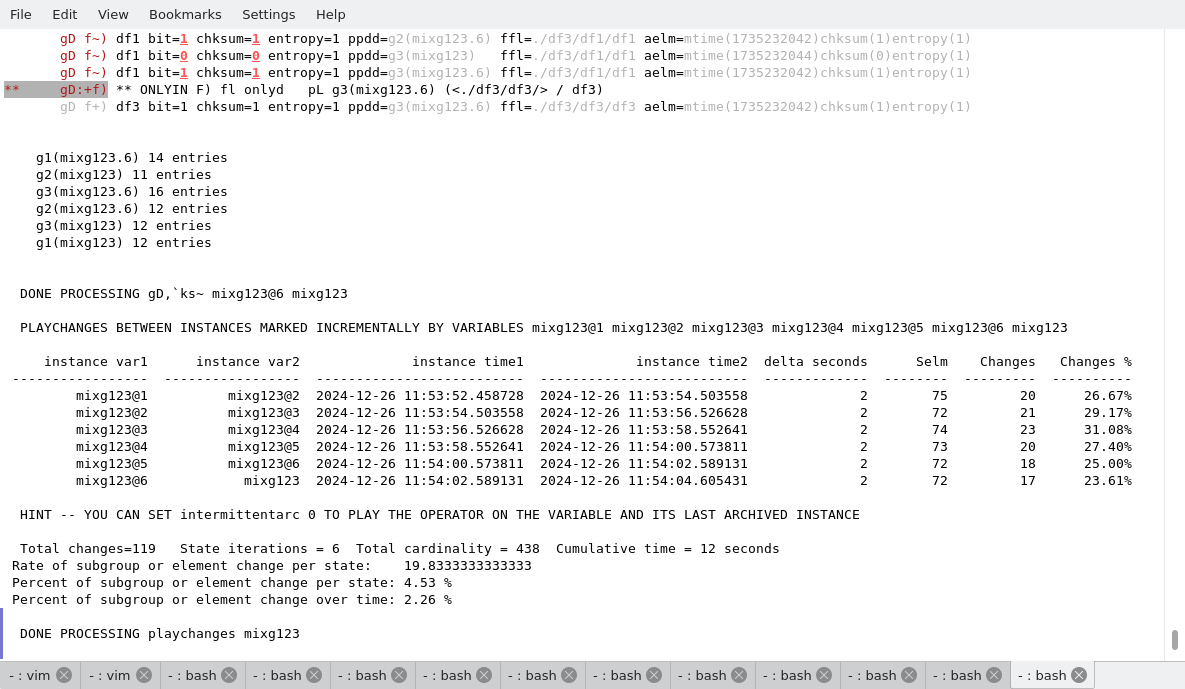
The following terminal shows the output when exercising with the playsim and playchanges in the sample workspace RANDONEBITMIX.
EXAMPLE2 Rate of Change in Dissimilarity in a FilesystemStart ASPL by loading the sample workspace WS1DIFF3. The differential group variable v1 contains the temporal variations captured in the directory /tmp/testdir1. In the following operations, we show the rate of changes in v1.
OPERATION2 Rate of Change in Dissimilarity in a Filesystem
A sample output of the rate of dissimilarity in the differential group variable v1 is shown in the following figure.
A sample output of the rate of changes in the differential group variable mixg is shown in the following figure.
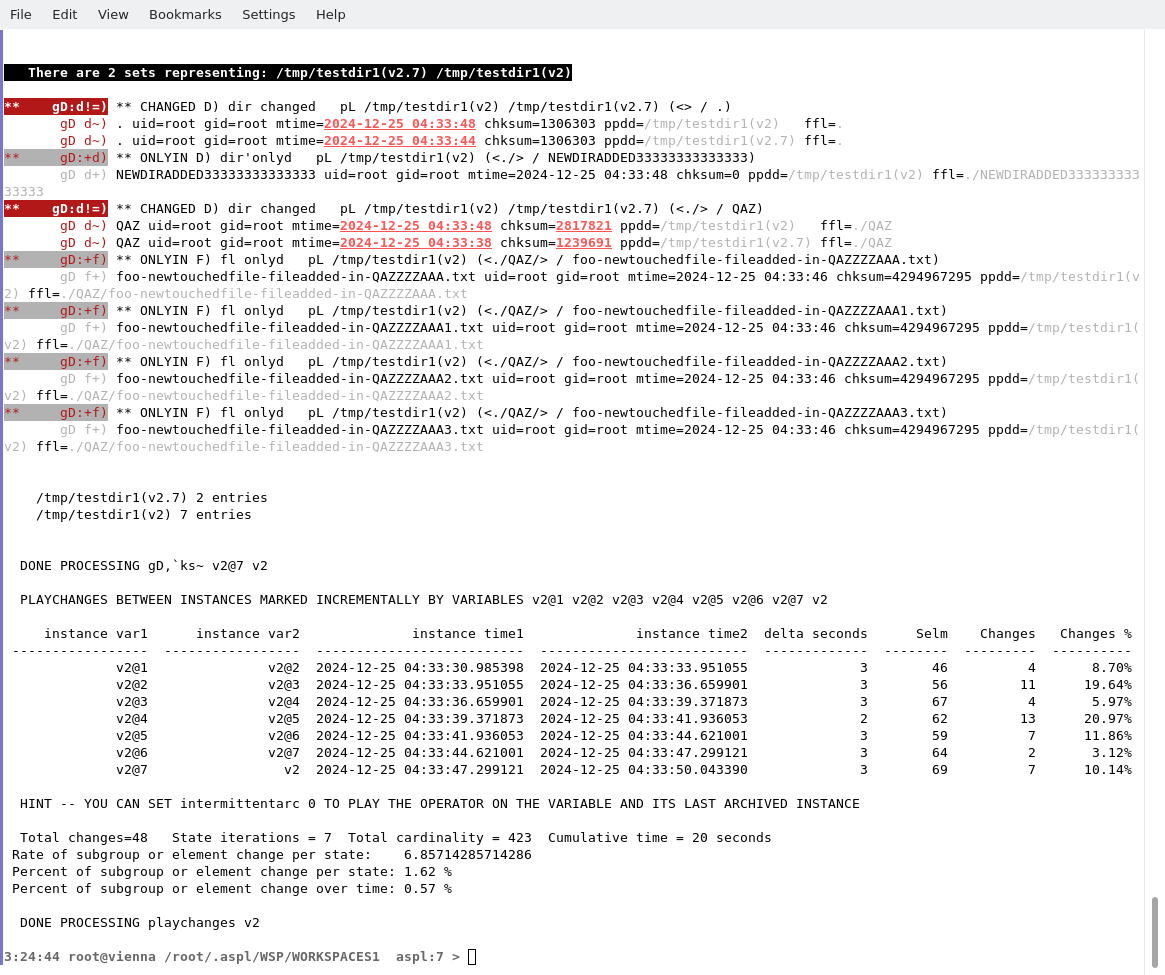
The following terminal shows the output when exercising with the playsim and playchanges in the sample workspace WS1DIFF3.